

Workforce Planning
In a contact centre, a telecoms operator, a field service or an outsourced operation, the number of people you need depends on the amount of work. That means forecasting the work to be done, converting it into the staff required, and comparing that with the staff you have and the staff you will have after hires and leavers. The shortfall or surplus drives labour cost, margin and the forecast.
We build Pigment workforce planning models that do this in one plan, owned by finance and shared with operations and HR. When the volume forecast or the attrition assumption changes, the required headcount, cost and margin update together.
Demand-Driven Capacity Planning
In a workforce-heavy business the staff required is calculated from the work to be done, so we build models that start from the work: contacts, calls, jobs, visits, rounds or tickets, multiplied by handle time and adjusted for occupancy, shrinkage and paid hours, to give the full-time equivalents required in each period, by site, team and skill.
Supply is built alongside it: the current roster, planned starters ramped over time, leavers and backfills. The gap shows while there is still time to hire and train, and the cost of closing it goes straight into the forecast. Intraday rostering stays in your scheduling tool; this model owns the monthly and quarterly plan above it.

Volume to FTE. Forecast volumes and handle times converted to required capacity, with productivity and service-level targets held as visible inputs.
Shrinkage you can see. Leave, absence, training and breaks as explicit assumptions, so the paid hours behind each FTE are not a guess.
Supply with ramp and attrition. New starters ramped, leavers and backfills included, so capacity is not overstated.
Scenarios. A volume surge, a contract won or lost, a productivity gain: the headcount and cost effect side by side.
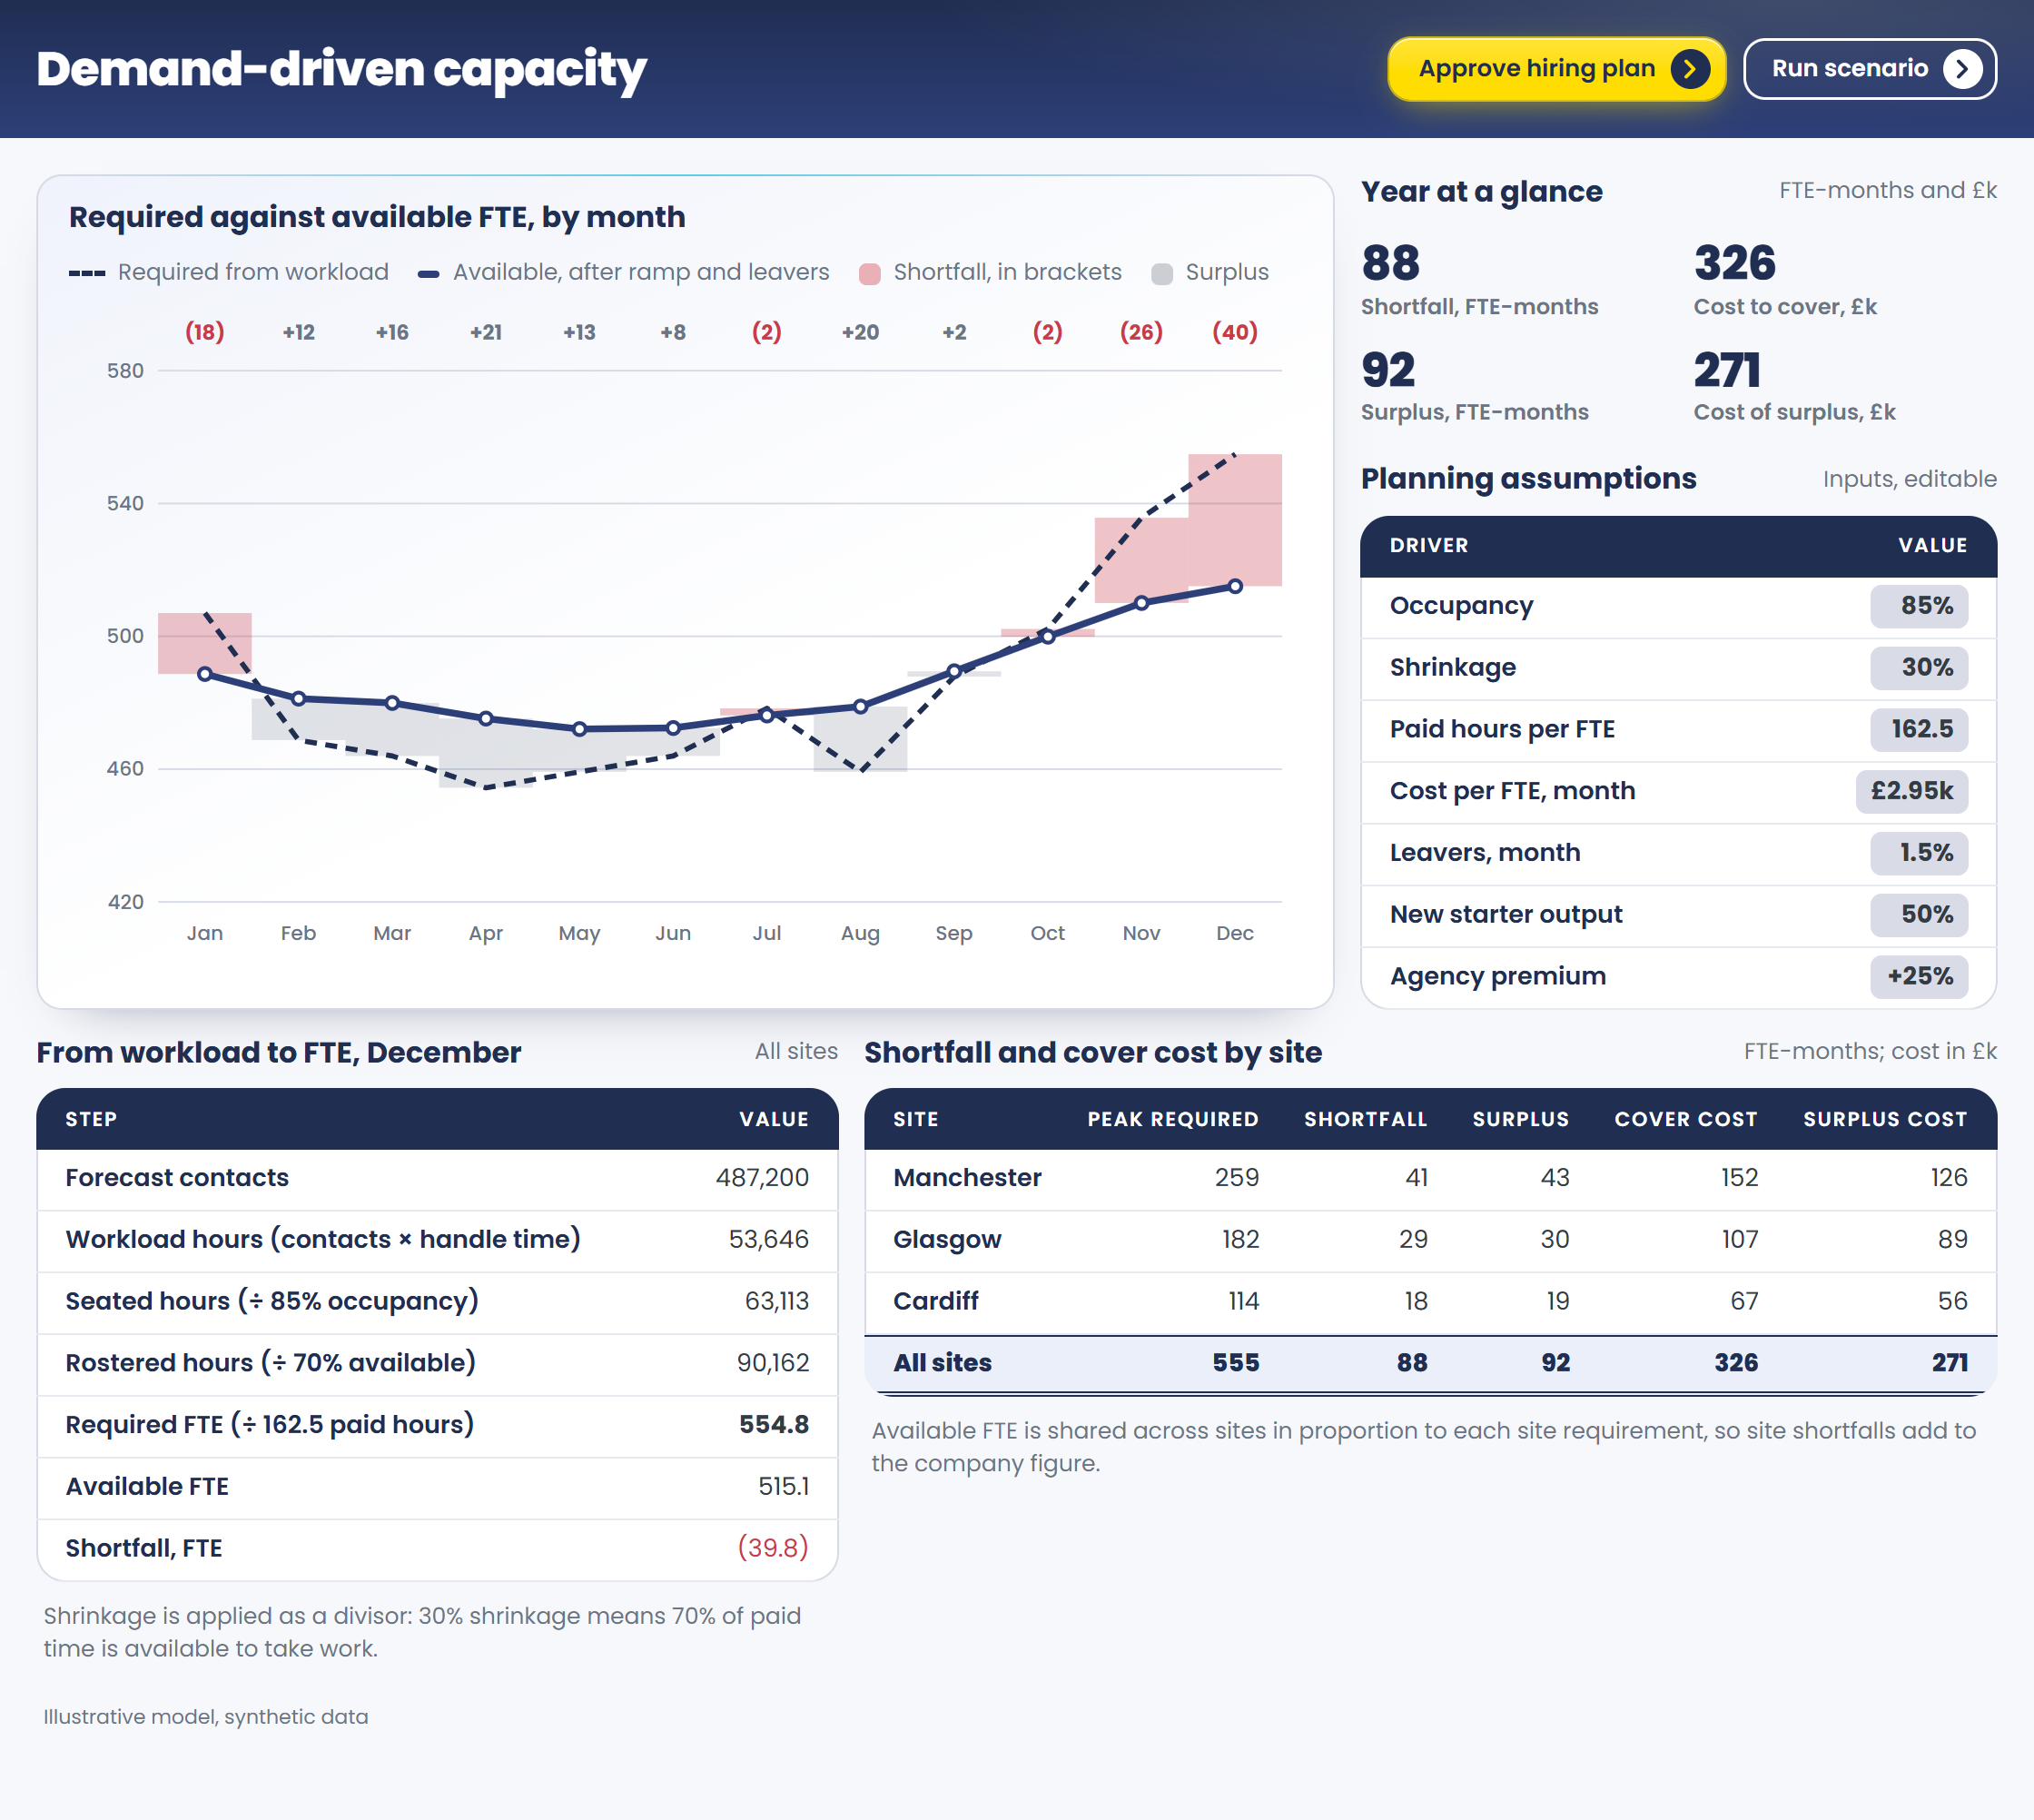
Required capacity against supply, and the hiring that closes the gap · illustrative model, synthetic data
Headcount & Position Planning
Finance sets the approved headcount budget, and operations and HR fill the positions within it. We build position-based plans, where a position persists as the people in it change, so funded, open and planned roles sit in one structure and finance can plan vacancies against budget without personal data.
Hires enter as requisitions, with leavers, transfers and promotions phased by start and end date. Hiring lag moves cost into the right month, and attrition creates backfill demand that the plan carries rather than discovers. Reforecast through the year as actuals arrive, and finance and HR work from the same positions.
Positions, not names. Open, filled and planned roles by job, grade and cost centre.
Hiring lag and backfill. Time to fill and attrition drive when cost lands and how many hires are replacements.
In-year reforecast. Starters, leavers and slipped requisitions update the plan as they happen.

Positions through the year, with hires, leavers and backfills · illustrative model, synthetic data
Workforce Cost & P&L Integration
Labour is usually the largest cost in a workforce-heavy business, so a change in capacity changes margin. We build cost models that put the fully loaded workforce cost in the cost-centre P&L: base pay, variable pay and employer on-costs held as rate tables by geography, with contractors and agency labour planned alongside employees on their own budget line.
Because capacity, hiring and cost are one model, a change in volume or a contract reads straight through to cost and margin. Most planners see pooled cost by role and cost centre; individual pay stays behind its own access rights.
Fully loaded. Pay, variable pay and on-costs by role and location, as rates anyone can inspect.
Employees and contractors. Permanent, agency and contingent labour in one view, each on its own line.
Straight to the P&L. Workforce cost by cost centre and contract, tied to the finance forecast.

Workforce cost from capacity to cost-centre P&L · illustrative model, synthetic data
Equal Pay & Gender Pay Gap Reporting
Pay is planned by the reward team and finance together, and the model gives each what they need from the same figures. Reward sees the current gap by role and grade, and the effect that planned hiring, promotions and pay reviews will have on it before they are approved. Finance sees the budget needed to remove the gap, phased into the forecast ahead of the report. Both track progress against the action plan. HR and payroll systems remain the source of record, and the pay data sits behind its own access rights.
Equal pay by role and grade. Pay for like work compared across gender, with unexplained differences flagged for review.
Gender pay gap measures. Mean and median gaps, bonus gaps and pay quartiles, with room for ethnicity and disability as the rules arrive.
Cost of closing the gap. The budget effect of adjustments by role and grade, phased into the forecast.
Test and track. The effect of hiring mix, promotions and the pay review before anything is approved, and progress against the action plan.

Where the gap is, and what planned decisions do to it · illustrative model, synthetic data
Headcount Control & Reconciliation
Finance's budgeted headcount and HR's headcount often differ because they count different things: full-time equivalents or heads, contractors in or out, offers accepted but not yet started. We build one position-anchored model with agreed definitions and feeds from your HR and recruitment systems, so a number means the same thing wherever it appears.
In year, every requisition is checked against the funded plan before it opens, and approved changes are effective-dated with a trail. The plan, the hiring process and the finance forecast stay aligned instead of drifting apart between reviews.
One set of definitions. FTE, heads, contractors and offers each counted once, in one agreed way.
Requisitions against the plan. Every new position or hire checked against funded headcount before it is released.
Governed change. Approved, effective-dated movements, with a trail for audit.

One headcount, reconciled between HR and finance · illustrative model, synthetic data
Why trust Vuealta with your workforce planning?
Maximising your staff costs and utilisation is the key driver of your business performance.
We have built models that turn forecast volumes and contact minutes into the capacity required, and headcount and payroll-cost plans that tie to the finance forecast, for banks, technology and services businesses.
We have extensive experience of reward and pay structures as well as planning, so a Vuealta workforce model reflects how pay, grading and hiring decisions actually work and what they cost, with forward looking models that allow you to plan the impact of future changes.
Workforce planning by industry
Every industry plans differently. See how these use cases apply to yours.
Tell us the planning problem
Bring us the volume forecast, the labour budget and the pay data, and we will show you what they look like as one model in Pigment.
Talk to a Pigment expert